

Data collection is a very important step in conducting academic research and can influence results significantly. Once the research question and sources of data are identified, appropriate methods of data collection can then be determined. Both Array’s form sharing and reports function can be extremely beneficial to serious academic data collection. Today we will focus on both of these Array functions in order to teach you how to gather accurate, tangible and above all trusted data with Array for your research projects.
Array Form Sharing
Sharing forms with your academic peers is the easiest way to digitize your existing workflow and eliminate excessive documents. You can choose which of your peers have access to specific forms, so if you have many people working on your project you can limit access to sensitive documents.
You can also share forms with the wider public for larger scale projects. Here are just a few more ways to share your Array academic research forms:
- .Embedding an iFrame code
- .Sending a survey link via email
- .Creating a public URL to host your survey online
- .Creating a QR Code that links to your form
- .Sharing a form on social media
- .Creating a custom link for your form
- .Redirecting a user to a specific webpage after completing the survey
 Reports
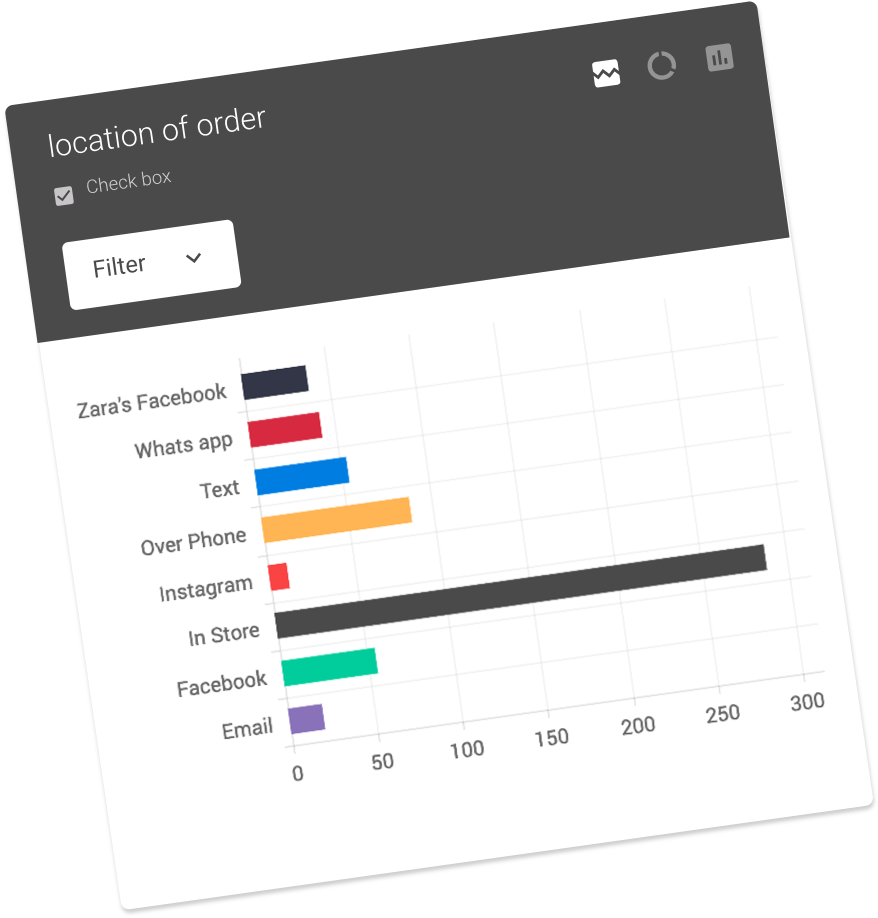
Reports can be a brilliant way to view your research either at the end of your project or simply to see your progress. Essentially the reports area is where you can view, download and analyze your captured data. You can filter your research data held in projects, forms and maps to segment and download any bulk or single elements that you want to examine for your project. In this area of Array, you can also see all of the data that was originally captured in your forms, and used to produce the reports.
You can also use the graph view to gain visual representations of your data. If you navigate to the graph view, you can manipulate the filters to view specialized segments of information. If you’ve created a relevant filter that you’d like to use again in the future, you can save it by clicking the “Save Filter Options” button in the navigation bar.
Merge Your Data
If your research consists of multiple data sets or is a multiple regressive analysis, your data doesn’t mean too much on its own. Rather, it’s the link between a user’s answer to several questions and it’s wider social meaning that is truly significant. In situations like this, you may want to merge response graphs together to get a clearer understanding of the data.
To do this, simply click and drag one graph on top of another; you will see a “Merge Reports” icon appear while the graph is being dragged. Once you let go, a new graph will be created that reflects the answers to both questions.
![]()
To get all the benefits of Array or to just find out how Array can help your small-to-medium business thrive, sign up here for free.